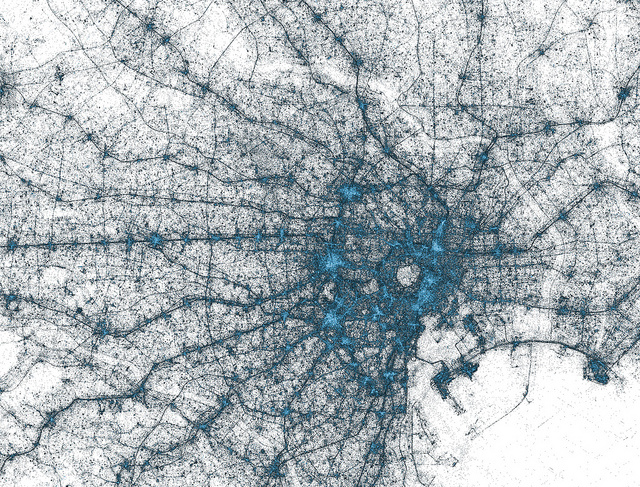
Twitter released images this morning of maps tracking geotagged tweets from 2009-2013. Billions of them! Each dot on the map actually represents one tweet, and the lighter colors represent higher tweet counts in those areas.
The three maps released on Twitter's blog today show a surprisingly clear views of Istanbul, Tokyo and New York City, and it's amazing to see how the tweets match up with not just population centers, but roads and traffic as well. Tweeting while driving? It definitely happens.
Check them out for yourself, and you can find more geotagged tweet maps on Flickr.

Istanbul:

Tokyo:

New York:
